


In a new book, data-viz guru Nicholas Felton highlights a wave of photographers mixing deep data into their art. The infographic designer is the ohor of Personal Annual Reports that weave measurements into a tapestry of graphs, maps and statistics to reflect the year’s activities. Now the creator of the Reporter app and Facebook’s Timeline is suddenly so interested in photography, curating a photography book called PhotoViz. Let’s call it… aggregated photography.
PhotoViz represents Felton’s overview of a field that goes as far back as photography itself, but is particularly ripe for exploration today, as we’re equipped with a whole new suite of post-production tools that are redefining photography as we’ve known it. As he points out, photographic pioneer Eadweard Muybridge was shooting galloping horses in the late 1800s as a way to quantify anatomy in motion for the first time.
In the modern era, new techniques — like stacking frames through Photoshop — have pushed the bounds of photo visualization further. Photo designer Peter Funch uses Photoshop to show dozens of New Yorkers yawning on the street at the same time. Many moments condensed into one, with all the irrelevant subjects cut out, has a poignant, life-affirming effect, writes Co.Design on Felton.

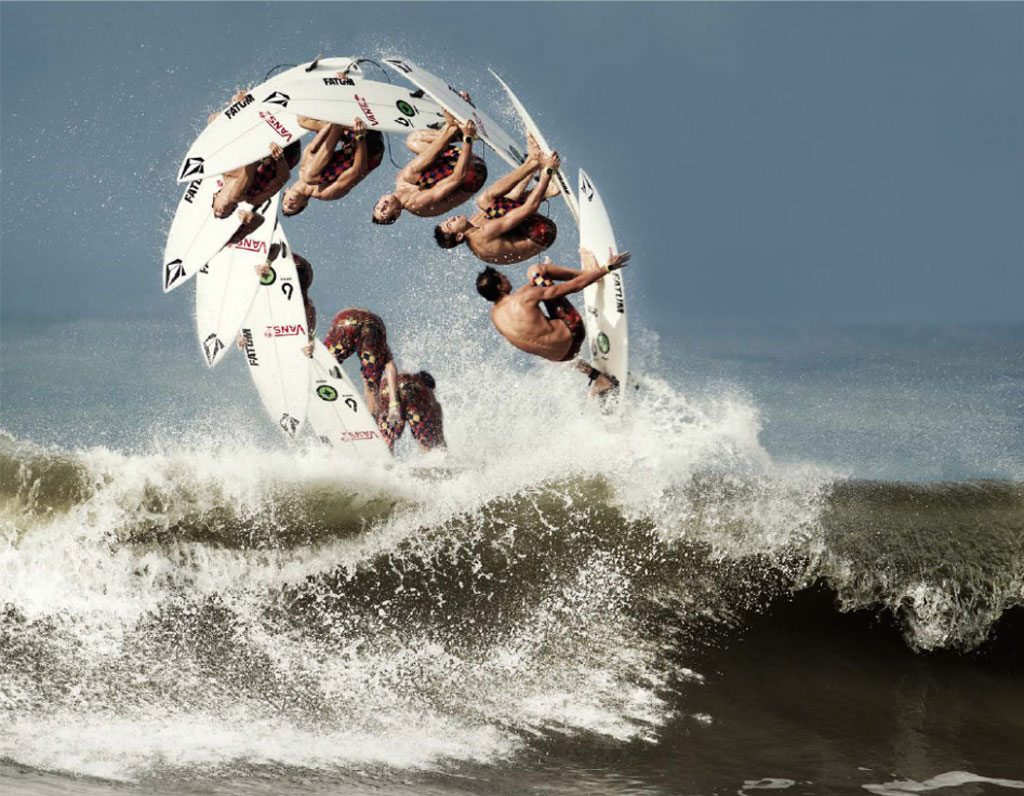
Or what’s possible today, when high speed cameras married with exposure stacking techniques help create single-frame, step-by-step sequences of snowboarding and skiing runs, letting the viewer track every nuance of an athlete’s movement:
And this is where Felton’s approach comes in. Whereas the best data designers have to work very hard to make you recognize the significance of a bar chart, photography is human at its core. It speaks in objects and faces, the language of life itself.
Writes Co.Design:
Which is why Felton believes the potential is only just being tapped now. As algorithmic technologies, like Facebook’s face-recognizing autotag feature, or Google’s Auto Awesome system, which can combine several failed family photos into one magical image where everyone is smiling, the possibilities for condensing and rearranging the data of photography is only growing.
Who is lucky enough to snap exactly the right moment to tell the exact story one wants to share? What about condensing 200 photos into something digestible?
And that’s what Felton’s book is all about. Images are omnipresent in our digital age, but they’re worth a closer look. Many of them can tell us stories in new and surprising ways. PhotoViz reveals how infographics and data visualization are currently impacting photography and points to innovative possibilities for the future.
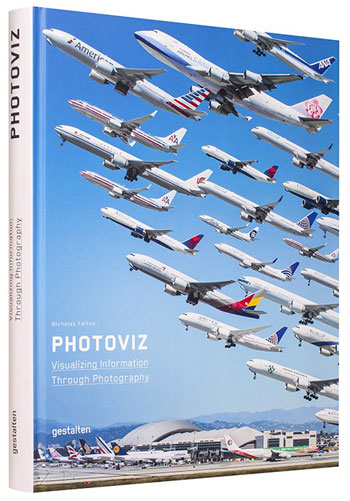
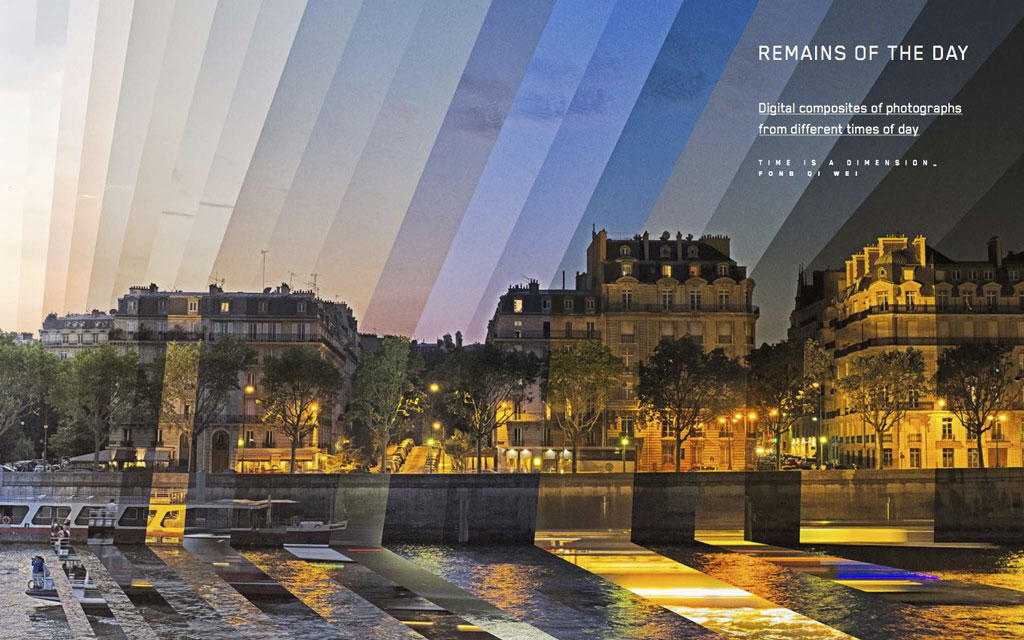
The work featured in PhotoViz, to cite only a few examples, makes invisible Wi-Fi fields visible, allows airport flight activity from a full day to appear as if it were happening at once, and illustrates the average selfietaking behavior of an entire city.
Here is the man himself on his photography and data quest: